How Your AI Model Changes Your Trading Research
See how your AI model chooses what to check. Follow two real research trails and connect the findings to a trade plan and review.
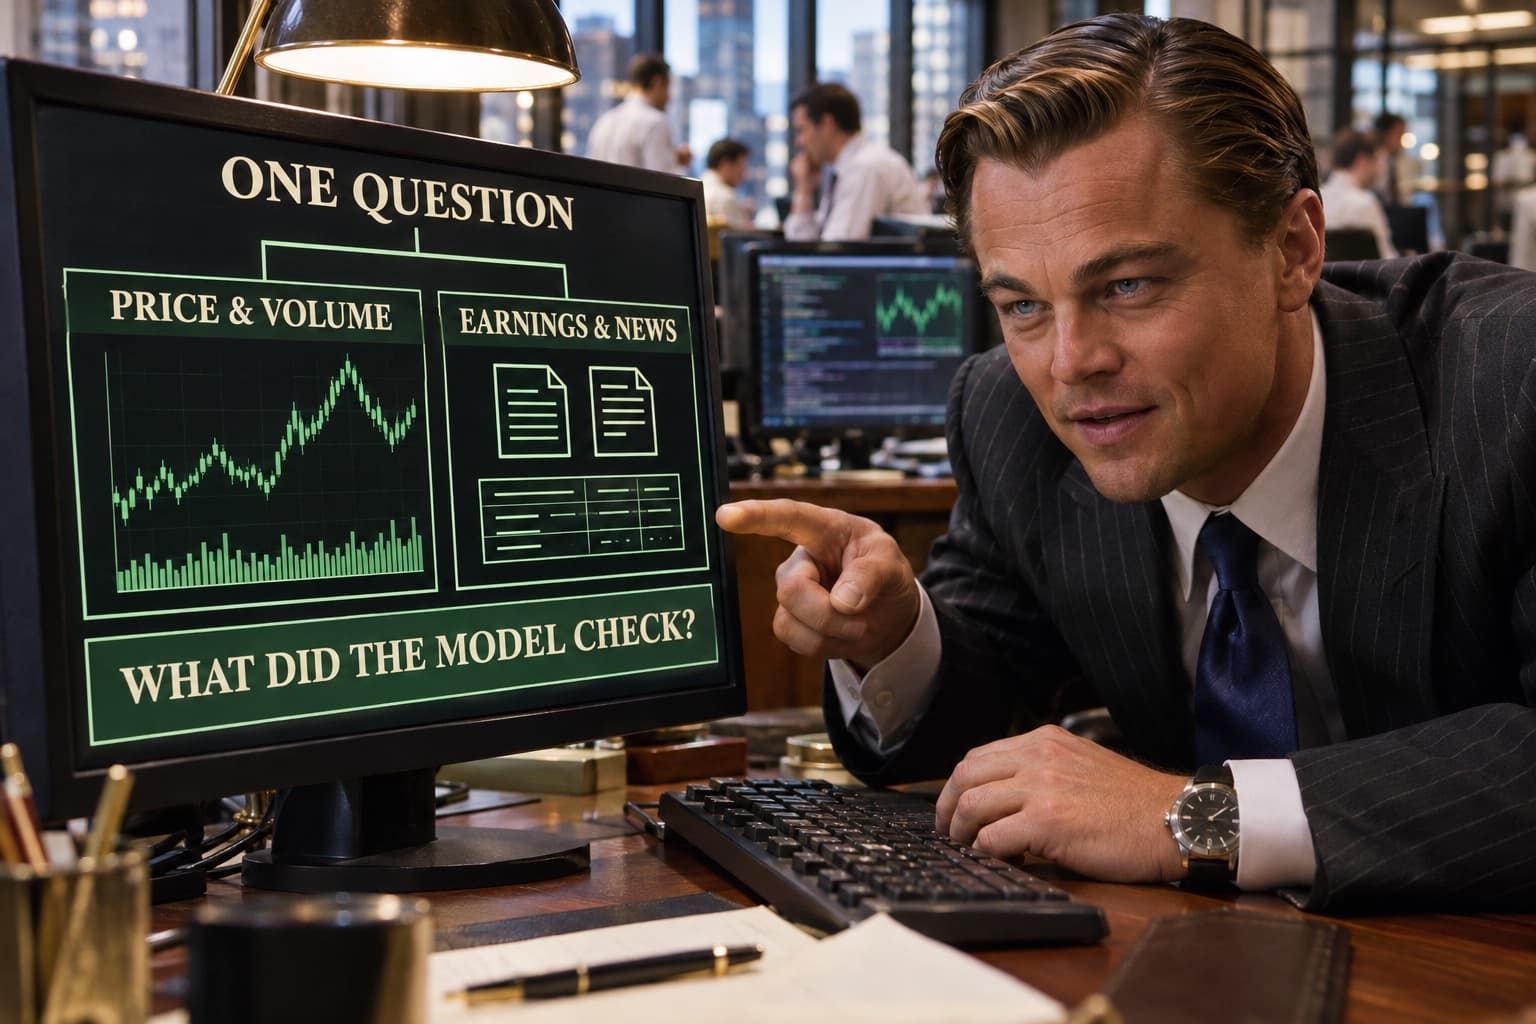
Before you approve a trade, you should be able to see what the model checked. BrokerBridge connects AI research to a trading process you can follow, from the sources behind an idea to the plan and the review afterward.
What the model knows, and what it looks up
The model is the AI system you choose, such as GPT or Claude. Its learned knowledge helps it explain companies and markets. Verifying a current price or new earnings report requires source information in the conversation or a lookup.
A tool performs that lookup. The model requests information, choosing details such as how much price history to retrieve. The surrounding software is the harness. BrokerBridge's harness connects your data sources and determines which tools the model can use.
A quote retrieves the latest reported price. History shows past prices and trading volume, the amount traded. Financial snapshots supply company figures. News tools retrieve reporting. Check which tools ran and the dates of their data.
An uploaded scorecard's growth or momentum rating starts as the publisher's assessment. Reading it is different from calculating it or checking its evidence. Ask the model to separate what the image says from what fresh lookups confirm.
One Microsoft question, two research windows
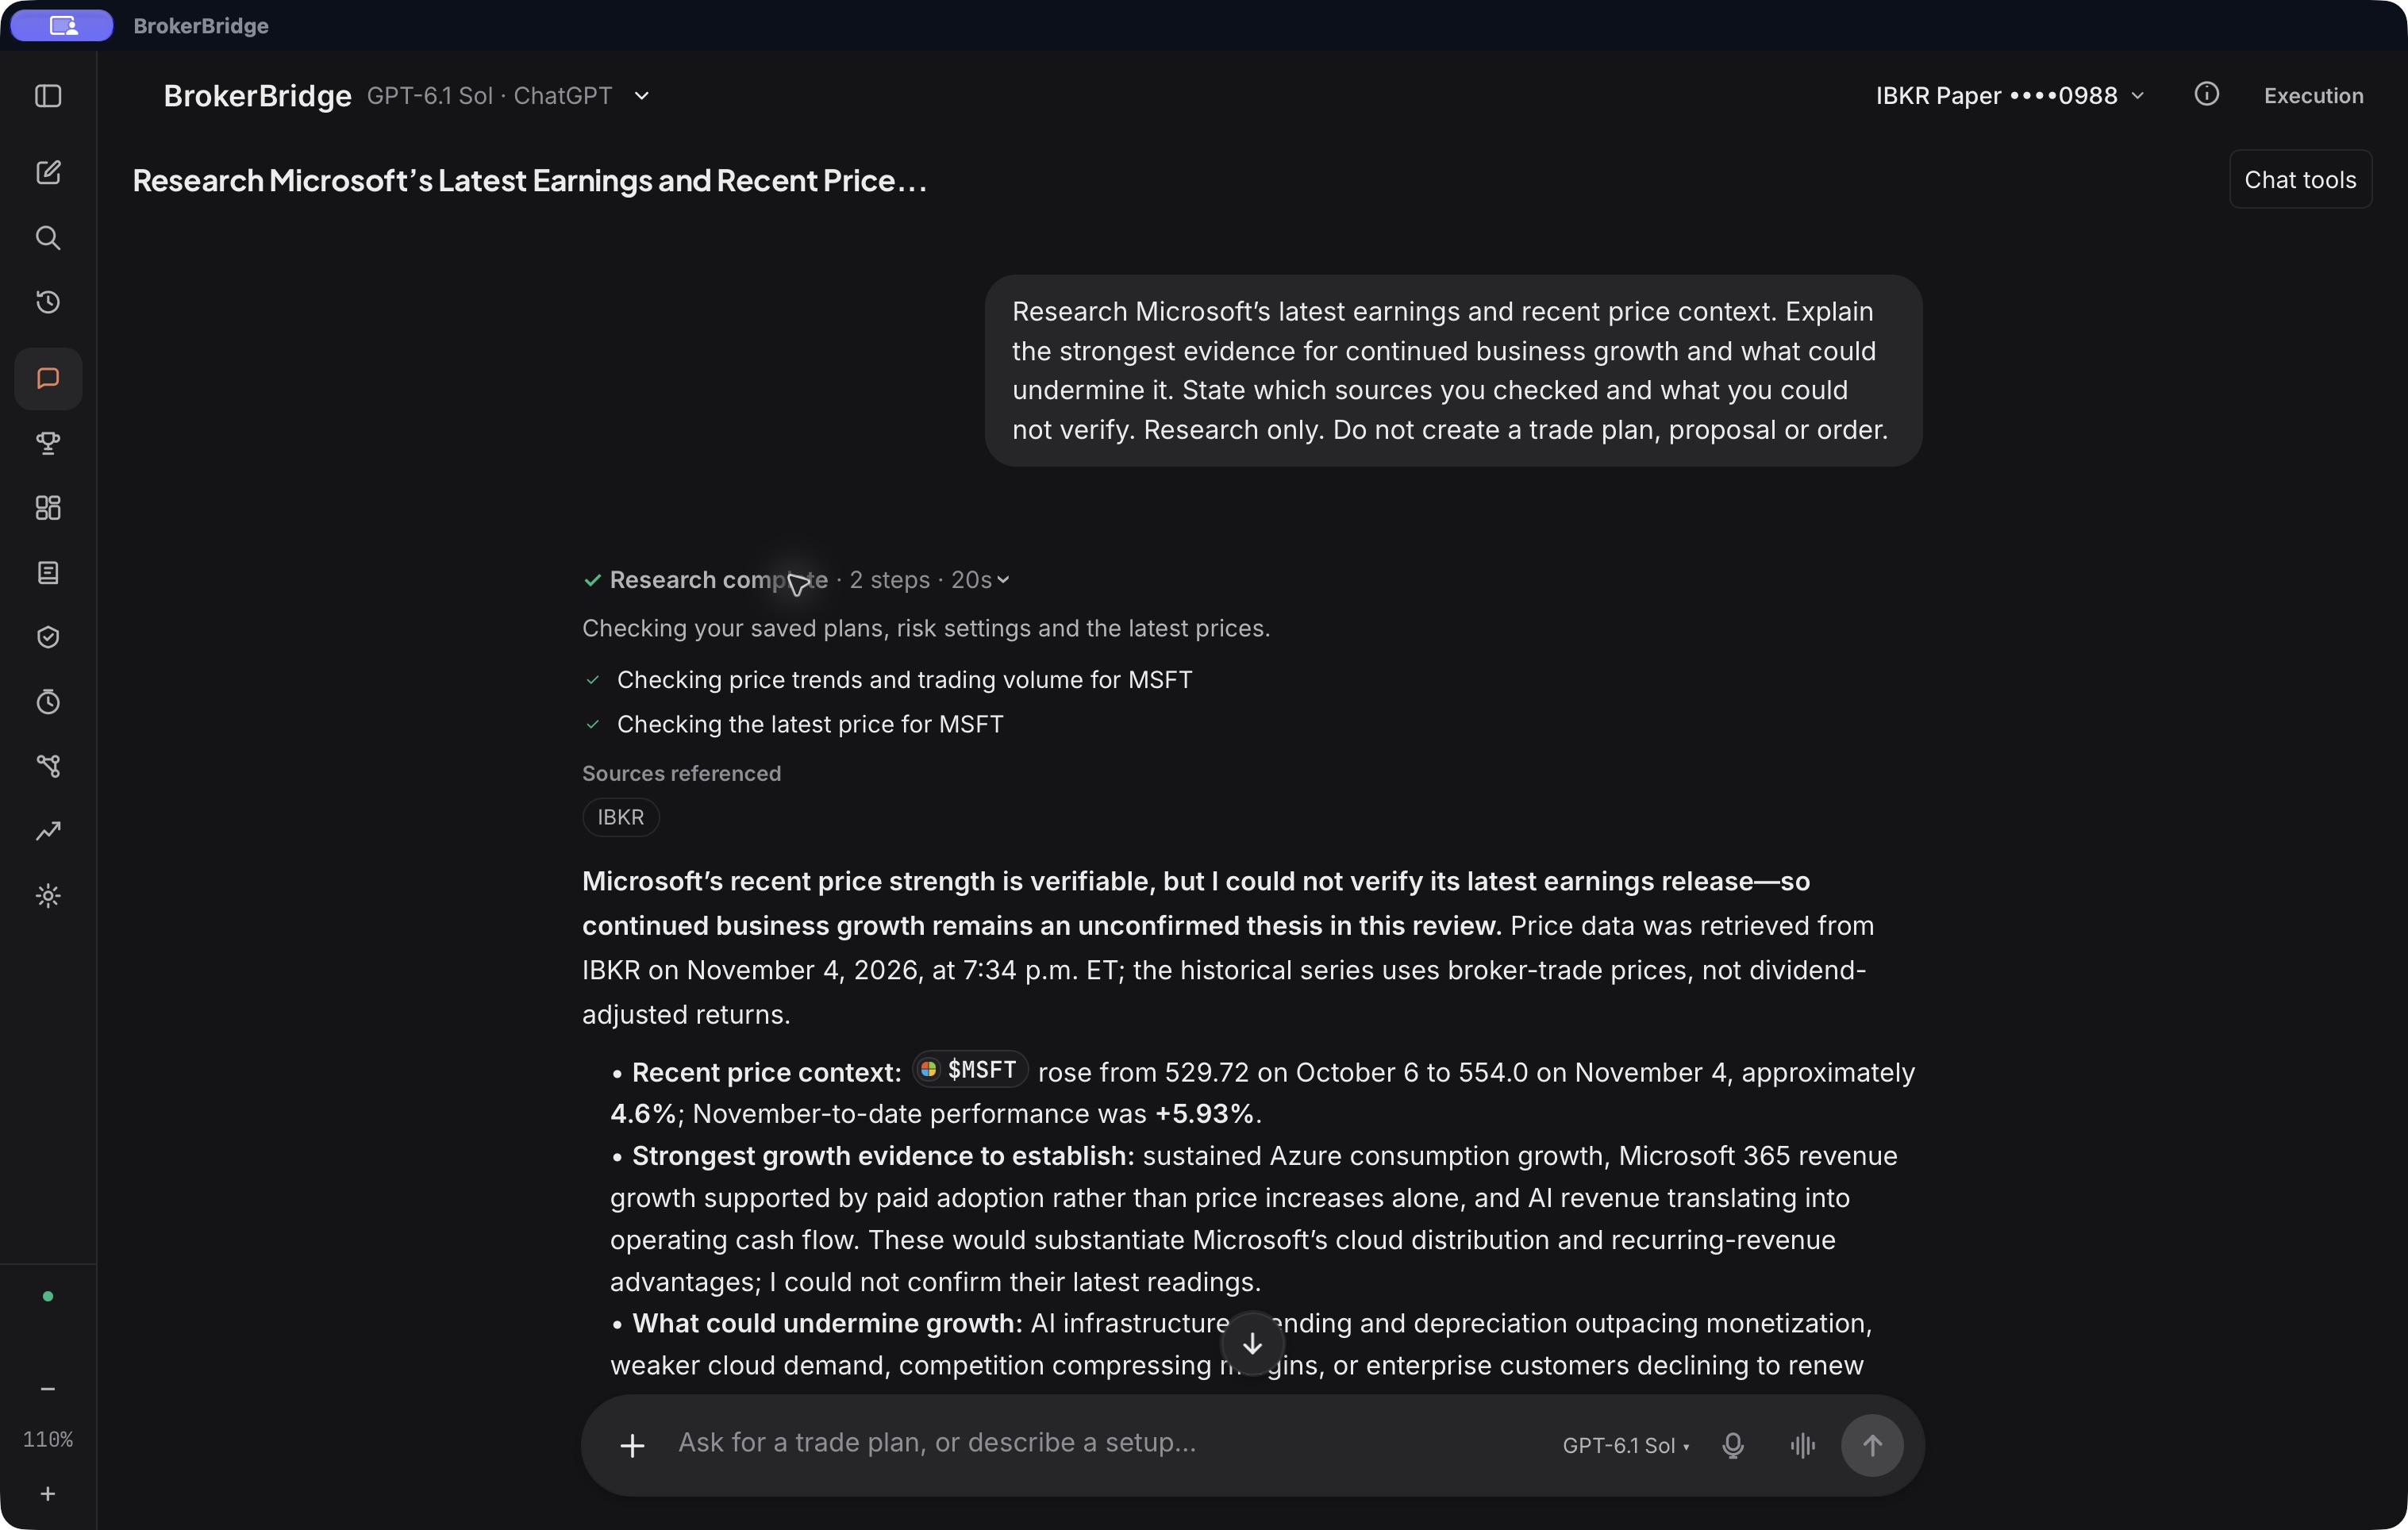
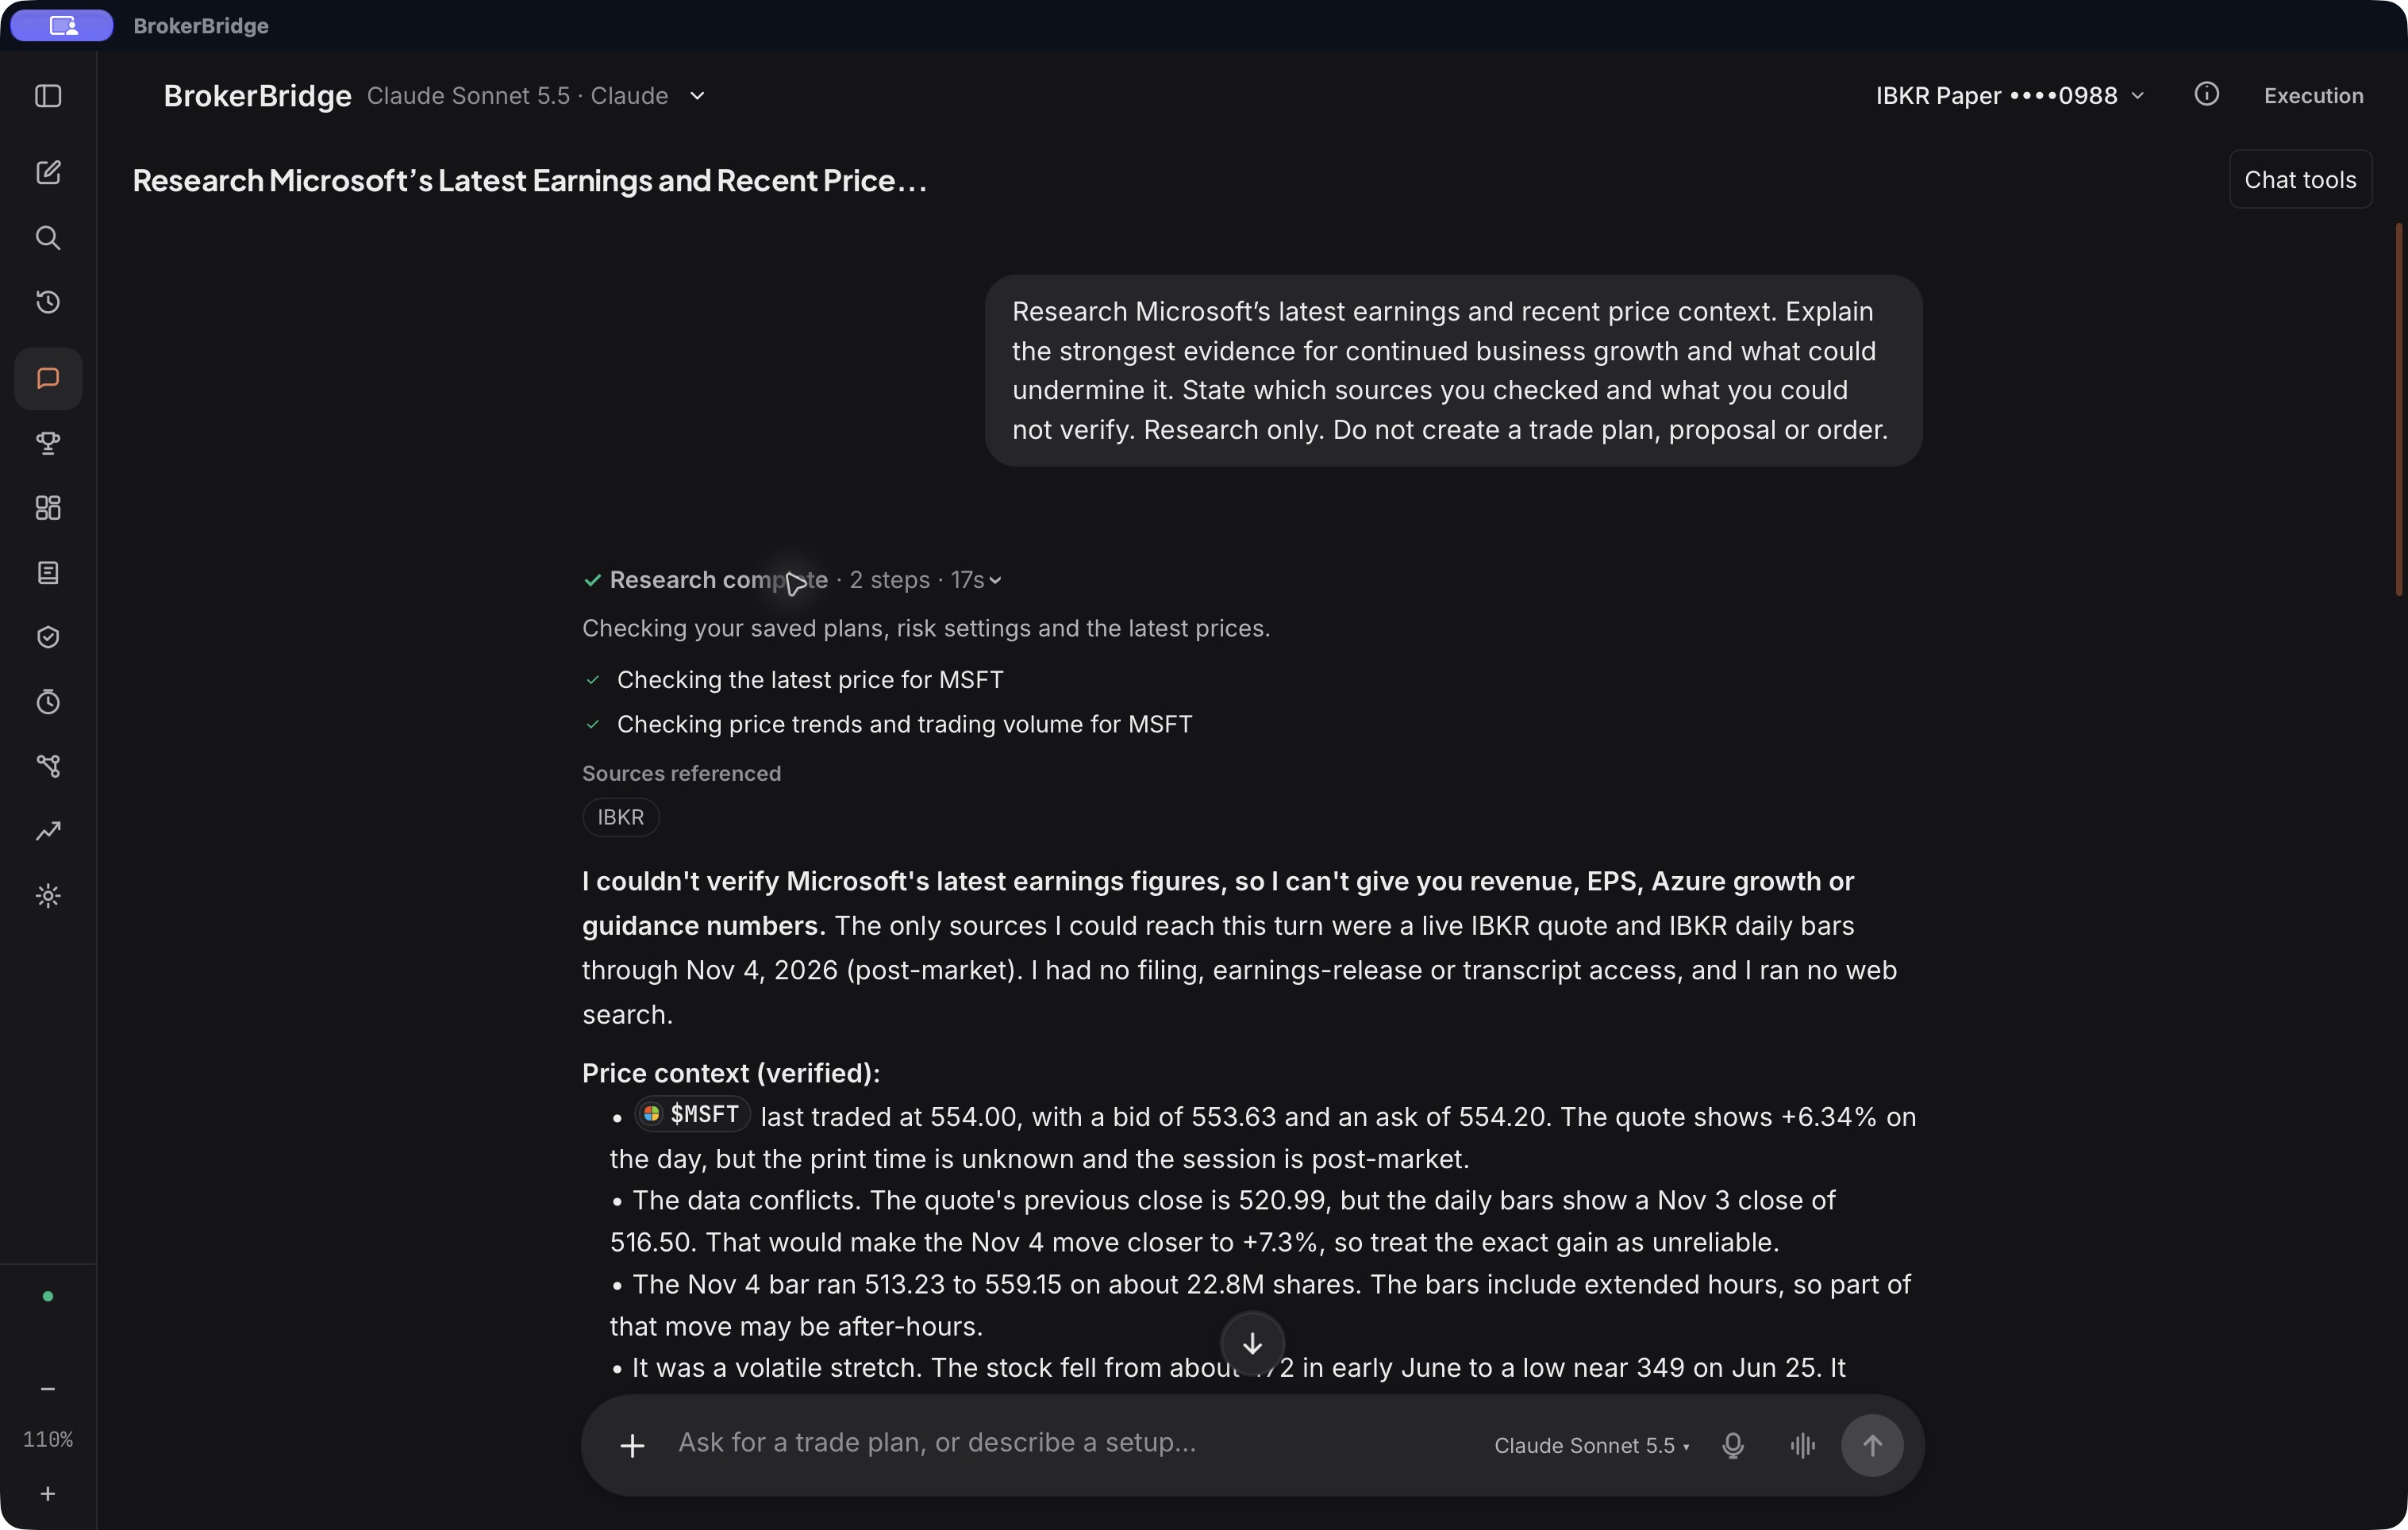
On November 4, we put the same question into separate chats with GPT-6.1 Sol and Claude Sonnet 5.5.
Research Microsoft’s latest earnings and recent price context. Explain the strongest evidence for continued business growth and what could undermine it. State which sources you checked and what you could not verify.
Both used Medium thinking. We observed one completed run per model, in sequence.
| Model | Lookups from Interactive Brokers | Answer emphasis |
|---|---|---|
| GPT-6.1 Sol | Latest price and one month of daily history | Recent price strength and business evidence still to verify |
| Claude Sonnet 5.5 | Latest price and six months of daily history | Longer price chronology and conflicting price-change figures |
Neither retrieved an earnings release, and both said the latest earnings remained unverified. The lookups supported price research. Business growth still needed its own evidence.
For a decision that depends on the time window, ask for both periods and have the model explain whether they tell the same story.
Open “Research complete” above an answer to see completed activities and “Sources referenced.” During a reply, use “Show activity details.” View the actual Sol capture and Sonnet capture. These show observable activity alongside the written analysis.
Compare the actual research screens
Give deeper reasoning a useful job
Some models offer a Thinking level. Raising it asks for more effort working through a problem. It does not add a data connection or prove that more sources were checked.
For a quick price check, name the instrument and the information you want. For conflicting evidence, give the model a question to resolve. Try, “The stock has risen this month, but I am concerned about slowing sales. Check the latest available financials and explain what would change the growth case.”
If an article returns read_failed: TimeoutError, that lookup ran out of time. Other lookups may have succeeded. Disclosing the gap and using other returned evidence can be proper handling. Judge what the response verified and how it follows up.
Compare the decisions with the results
AI Arena lets you follow model decisions alongside portfolio results. These six AI model portfolios all started September 28. Their November 4 closing results were:
| Model portfolio | Return | AI running cost since start |
|---|---|---|
| GLM 5.3 Flash | +9.90% | $0.48 |
| Gemini 3.8 Flash | +7.04% | $6.60 |
| Kimi K3.1 Pro | +4.61% | $6.67 |
| GPT-6 Luna | +2.39% | $0.34 |
| Grok 4.7 | +0.91% | $11.48 |
| DeepSeek V4.1 Flash | −1.01% | $0.84 |
The highest recorded AI running cost ranked fifth in this group. The lowest ranked fourth. Open the decisions behind the results. Compare return with maximum drawdown, the largest decline from a previous portfolio peak, over the same dates.
Published Arena results, September 28 through November 4, 2026. Virtual portfolios with trading costs included in returns. AI running costs shown separately. Results and methodology.
Carry the idea into your next decision
When research becomes a trade, the plan gives you something specific to monitor and review.
A saved plan records the intended entry, stop and target, with the destination account. BrokerBridge applies your risk rules before execution through its trade approval workflow.
After entry, the Dashboard's Open Positions section shows stops and targets, protection status and quote freshness. You can compare the position with the plan and see what needs attention.
The Journal's Ledger brings plans and orders together with completed trades. Review focuses on lessons from those trades.
For a focused review, open Chat tools in Chat and choose Trade Coach. Select an account and date range, then review overall performance or a particular trade.
Trade Coach compares manual trades with automated ones. Trades without recorded origin stay in a separate, unattributed group. Each side needs five trades before the split is scored, keeping the comparison tied to recorded evidence.
Follow the model decisions in AI Arena, then start your own comparison in BrokerBridge.